The State of the Cotswolds Rivers

The state of the Cotswolds Rivers

Discharge Update 2022

The water companies continue to disappoint us....

A recent article in The Times, Saturday 5th November, 2022, summarises the state of our rivers, and offers a possible explanation for the degradation. Ashley Smith has lived in Widford, on the River Windrush since 2013. Ashley  started to notice changes in his local river, changes that indicated that something was seriously wrong with the health of the river.  “The striking thing was the loss of aquatic weed. In these limestone rivers, you should get plenty of ranunculus [water crowfoot, a species of buttercup with vivid green foliage]. In the first year we were here, there were a few strands. The next year, it was gone. Same with the fish. The first year, I saw five big barbel and two chub spawning in the gravel. The next year, there were three barbel. I haven’t seen a fish since. And all the while, the water was getting murkier.” (Copyright: The Times)

Ashley is a retired police officer and he started to investigate the possible causes of the changes he was seeing. His first stop was the Environment Agency, where he expected to find a record of water sampling, monitoring and oversight. The records were sadly lacking and he realised that there seemed to be a regime of the water companies and a self-regulatory framework. Unsurprisingly, marking your own homework generates good grades. Further, there were obvious gaps in the reporting and Ashley Smith went in search of someone who could help with data collection and analysis.

Peter Hammond was a neighbour and a data analyst, and after consultation with him and with other interested locals  Windrush Against Sewage Pollution (Wasp) was formed.

Water companies treat sewage and water run-off, and it is inevitable that mixing these two sources can generate peaks in flow. At these times the sewage plant can become overloaded, and water companies can allow untreated sewage to be discharged directly into rivers. The framework is one of exception rather than the rule. Analysis of the data provided by the water company (Thames Water in this case)  showed an extraordinary number of days on which discharges took place, 735 days in a three-year period. Comparison with the reports from the Environment Agency revealed an gulf in reporting that calls into question the behaviour of the water company and the Environment Agency. The Environment Agency, using data provided by the company, had recorded 33 such spills in the previous 11 years for Thames Water.

Understanding just how this dreadful record of pollution and mismanagement is complex. A toxic cocktail of lax legislation and regulation, loose frameworks, a history of 'slap on the wrist' fines for breaches and slashed budgets at the regulator.

The good news is that this issue has become a national scandal. There is a growing body of organisations who are monitoring there local rivers, demanding data from their local water companies and asking questions of their MPs and planners.


Local government is beginning to hold the water industry to account, surely a job for our national bodies but it seems they have let things slip.

1. Discharges of raw sewage were reported 1,260 times into Cotswold rivers in 2020.

2. The Rivers Trust shows sewage discharges across all locations in the Cotswold district in 2020 occurred for 17,609 hours in total.

3. Such discharge is allowed as an emergency response to exceptional conditions, not as a routine.

4. In response to a petition on such discharges, the Government has stated that ‘Tackling the harm caused by sewage is a top priority for Government’.

5. The Government has stated that ‘Climate change has led to increased rainfall and water infrastructure has not kept pace with development growth’.

6. In addition to having a negative impact on local wildlife and forcing a local watercress farm to cease trading, this also hugely affects the quality of life and the enjoyment of water-based activities for residents along the course of the rivers and at times causes contaminated water to be on roads and pavements, and into local properties.

Taken from Nature, using machine learning to identify peak flow discharges


Peak flow detection from sewage treatment works

The area to the left of this chart shows typical sewage flows through the treatment works - a steady rise and fall linked to time of day. The central portion, highlighted with the solid bars above indicates flows that are not normal. The volume clearly reaches a high point and then the peaks and troughs disappear, indicating that the the treatment plant has a finite capacity, and that this has been breached. There is an expected lag between highs and lows in the rainfall chart and volumes in the treatment works; it takes time for runoff to reach the infrastructure. What is alarming is that even periods of low rainfall drive high levels of discharge. Further, in the analysis of the data it was found that there were spillages of untreated sewage on days where no rainfall occurred one or two days previously - a so called 'dry spill' and not permitted under any circumstances.

The cumulative effect of such disregard for the regulations is pollution, weed die back, fish population collapse, invertebrate life eradication and sewage fungus.

Further Reading

View down the River Windrush Valley

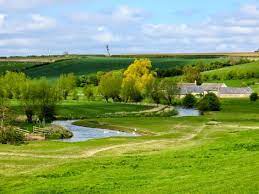
Two Anglo-Saxon words, wen, meaning to wind or meander and risc, which means rush or reed are joined to give us the the name of the Windrush river. Both the meanders and the reeds are still in view to this day. The modern course of the river includes flood meadows and open countryside, together with steeper sided banks in woodland areas. In the 8th centruy, the river was commonly crossed by fords, often stone lined. However many of these have been replaced by stone bridges, some of considerable age.

Typically a cold and clear waterway, atleast until recent problems with sewage pollution,  the river today is detached from its commercial use in years gone by. There were many mills along its length and its course has been altered to meet local industrial need; for example straightening in Naunton and redirection into Bourton on the Water.

It flows through the Cotswold limestone, reflecting the many hues and shades of the local quarries, used to build cottages, manors and churches and add fine stone rooves. Looping and running in series of s-bends that in some cases can almost create islands it is a very attractive river.

In the past, the high water quality supported a teeming wildlife, including barbel, brown trout, chub, dace, gudgeon, perch, rainbow trout, roach and grayling. Large numbers of English freshwater crayfish could be found, now sadly displaced by the American signal crayfish. There are good hatches of mayfly, damsel fly and dragon fly together with sedges, olives and hawthorn flies.

Swans, geese and ducks are still plentiful and water voles, water rats and otters can be seen.

The otters have returned and the water vole population has recovered due to the management and improvement of the local grassland. Husbandry and farming practice has been adjusted to benefit the river habitat, for example the Water Vole Recovery Project.

The biggest challenge faced by the river is that of sewage pollution. Windrush Against Sewage Pollution (WASP) is a charitable organisation that has been formed to combat the illegal discharge of untreated and incompletely digested sewage into the river.

You can find out more about WASP and its activities here. The seriousness of the current threat will be appreciated when you read of the support from our local MP and that the state of the river was recently featured in a parliamentary committee meeting on the environment.

A short video can be found on Youtube, here, and this will also take you to many other reviews of the river water quality.

Share by: